Breast Cancer Diagnosis Using R
machine-learning data-science healthcare R
Introduction
- We analyzed the Wisconsin Breast Cancer dataset (569 samples, 32 features) to predict benign vs malignant tumors.
- We applied feature selection to drop low-importance attributes before training.
- We implemented and compared several ML algorithms in R, focusing on accuracy, sensitivity, and specificity.
Dataset: https://www.kaggle.com/uciml/breast-cancer-wisconsin-data
Why R?
- Open-source language with strong statistical and visualization packages.
- Excellent ecosystem for data wrangling, plotting, and ML experimentation.
Modeling Pipeline
1. Pre-Processing
- 569 examples, 32 features.
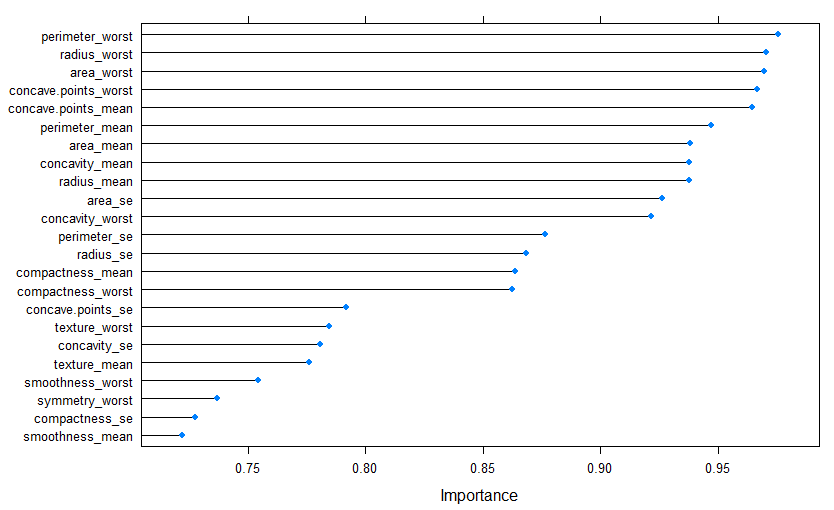
- Used feature selection to rank features by importance and drop the least useful ones.
2. Classification Methods
We tested three classifiers:
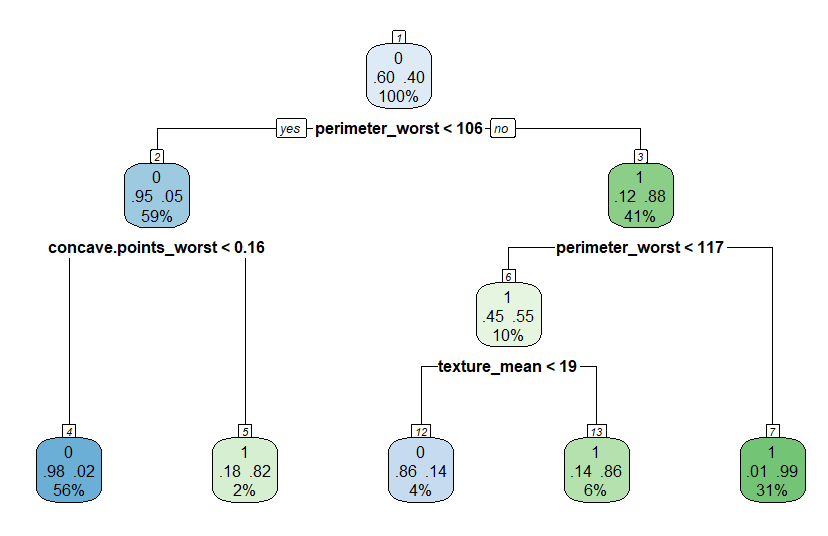
Decision Tree
- Supervised ML algorithm where each node represents a feature and leaves represent outcomes.
- Commonly used for disease diagnosis (breast cancer, ovarian cancer, heart sounds, etc.).
- Metrics: Accuracy 92.1%, Sensitivity 93.1%, Specificity 90.68%.
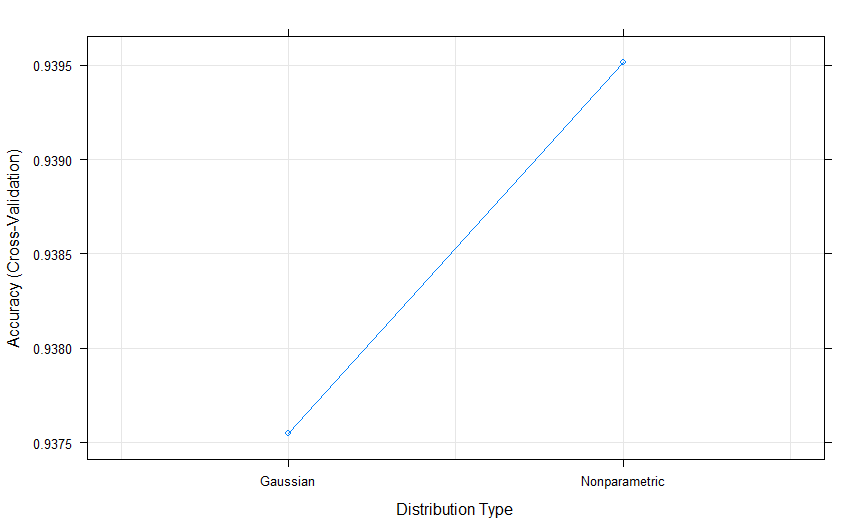
Naive Bayes
- Based on Bayes’ theorem: P(A|B) = (P(B|A) * P(A)) / P(B).
- Metrics: Accuracy 93.8%, Sensitivity 95.69%, Specificity 92.67%.
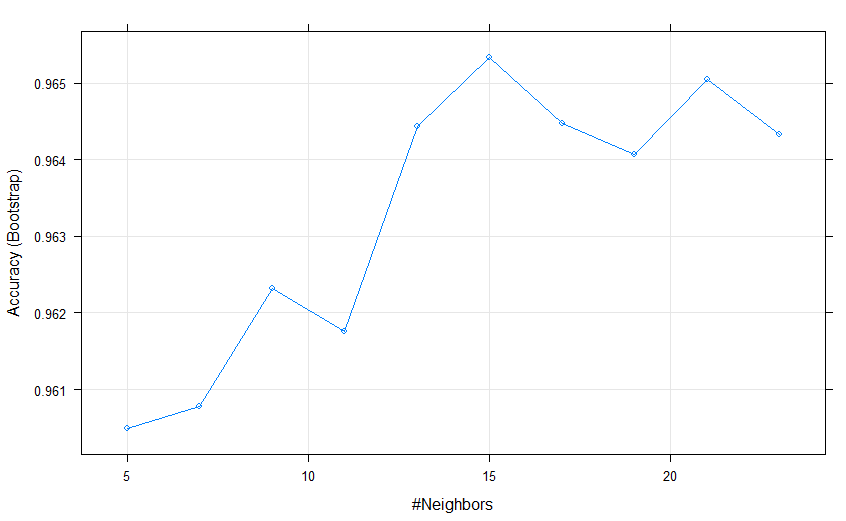
KNN
- Classifies by majority vote of the k nearest neighbors.
- Metrics: Accuracy 96.67%, Sensitivity 99.47%, Specificity 92.29%.
3. k-Fold Cross-Validation
- Split the data into k folds (commonly k = 5 or 10).
- Train on k−1 folds and validate on the remaining fold, rotating through all folds.
- Larger k reduces bias by keeping training sets closer in size to the full dataset.
Findings
- KNN delivered the best balance of accuracy and sensitivity on this dataset.
- Feature selection improved model performance by removing noisy predictors.
- Cross-validation confirmed the robustness of the chosen hyperparameters.